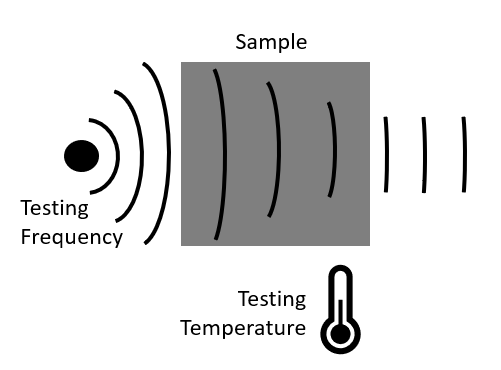
Dielectric properties of our plastics become very relevant when it comes to applications in the high frequency domain, such as 5G communication. This tool offers you insights into both the dielectric constant and the dissipation factor as function of temperature and frequency.
- Introduction
- Measurements
- Model
- F.A.Q.
User input:
- Grade selection
- Temperature of application
- Frequency of application
Tool output:
- Prediction of the dielectric constant dk as function of temperature/frequency
- Prediction of the dissipation factor df as function of temperature/frequency
- Values of dielectric constant, dissipation factor and resistivity at the selected conditions

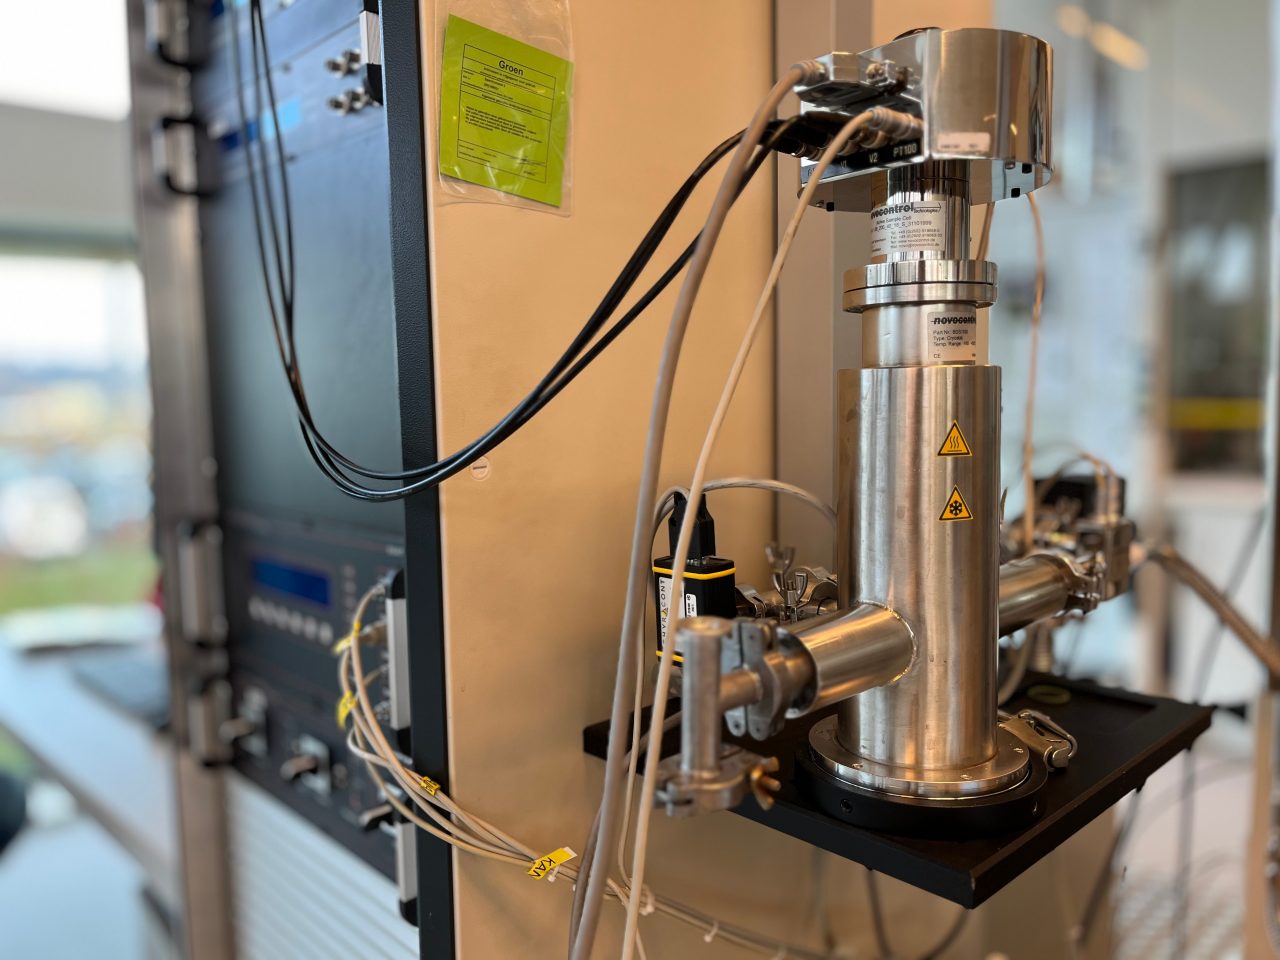
- The measurements at low frequencies (0.1Hz-1MHz) are performed according to IEC 62631-2-1.
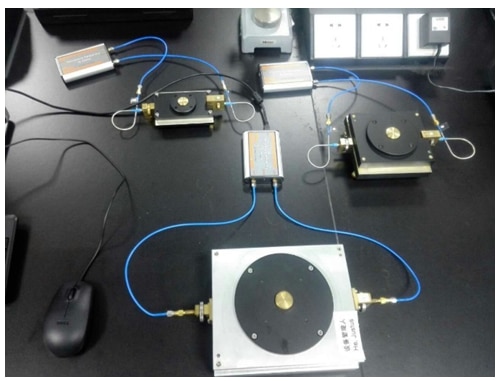
- The GHz measurements are performed with split-post-dielectric-resonator (SPDR) method following IEC 61189-2-721.


Model creation
The model is based on physical experiments covering a wide range of temperatures and frequencies:
- -30°C(-22°F) to 80°C(176°F)
- ~0.1Hz to 1MHz and 5GHz
At the certain frequency ranges (1MHz to 1GHz, 10GHz to 100GHz) and at various temperatures, there is lack of practicable measurement methods. Thus the dielectric properties are deduced from physics modelling and existing data. By fitting the Havriliak–Negami equations, the dielectric data can be predicted for a wider frequency range (0.1Hz to 100GHz).
Accuracy
- On average, the standard deviation (1 sigma) is around 5%.
- Currently, we do not provide predictions below -30°C (-22°F), above 80°C (176°F) or above 100 GHz. The predictions above 5GHz are model extrapolations.


Please use the Hotjar feedback form on the bottom right of the dk-df tool page to submit your comments, questions, and feedback. Most frequent questions will be answered in this section.
Why can't I select all Envalior grades?
We're in the process of expanding this tool to more grades, but this depends on the availability of experimental data as well as on the demand for that particular grade. Let us know what grades you're looking for by filling in the feedback form on the bottom right of the page!
Why am I not allowed to export the data from the graph?
Everyone can use the download functionality once logged in; simply register (for free) and immediately start downloading.
