Cyclic loading may result in material failure. This tool predicts the fatigue curve of our grades for any given temperature and humidity. Easily calculate after how many cycles your part will fail, or how much stress it is able to endure!
Read our blogpost with more information about this tool here.
- Introduction
- Measurements
- Model
- F.A.Q.
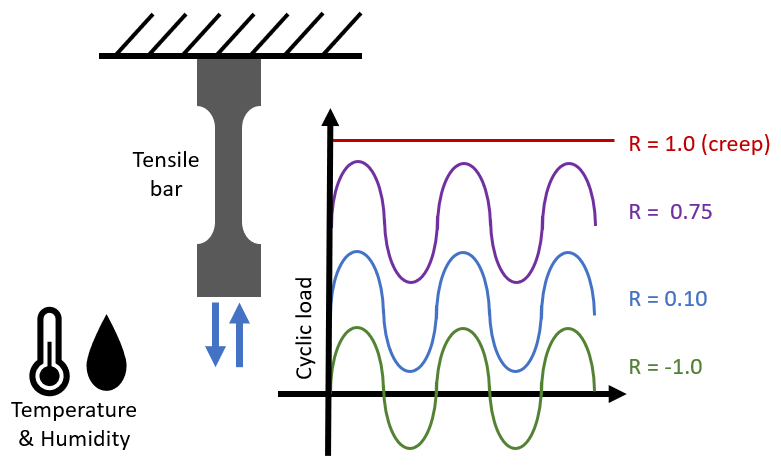
Fatigue is the failure of the material (tensile bar) due to cyclic loading. Various cyclic loadings can be applied, characterized by the ratio 'R' between the minimum and the maximum amplitude.
User input:
- Grade selection
- Temperature of application
- Relative humidity of application
Tool output:
- Prediction of the fatigue curve at the selected condition

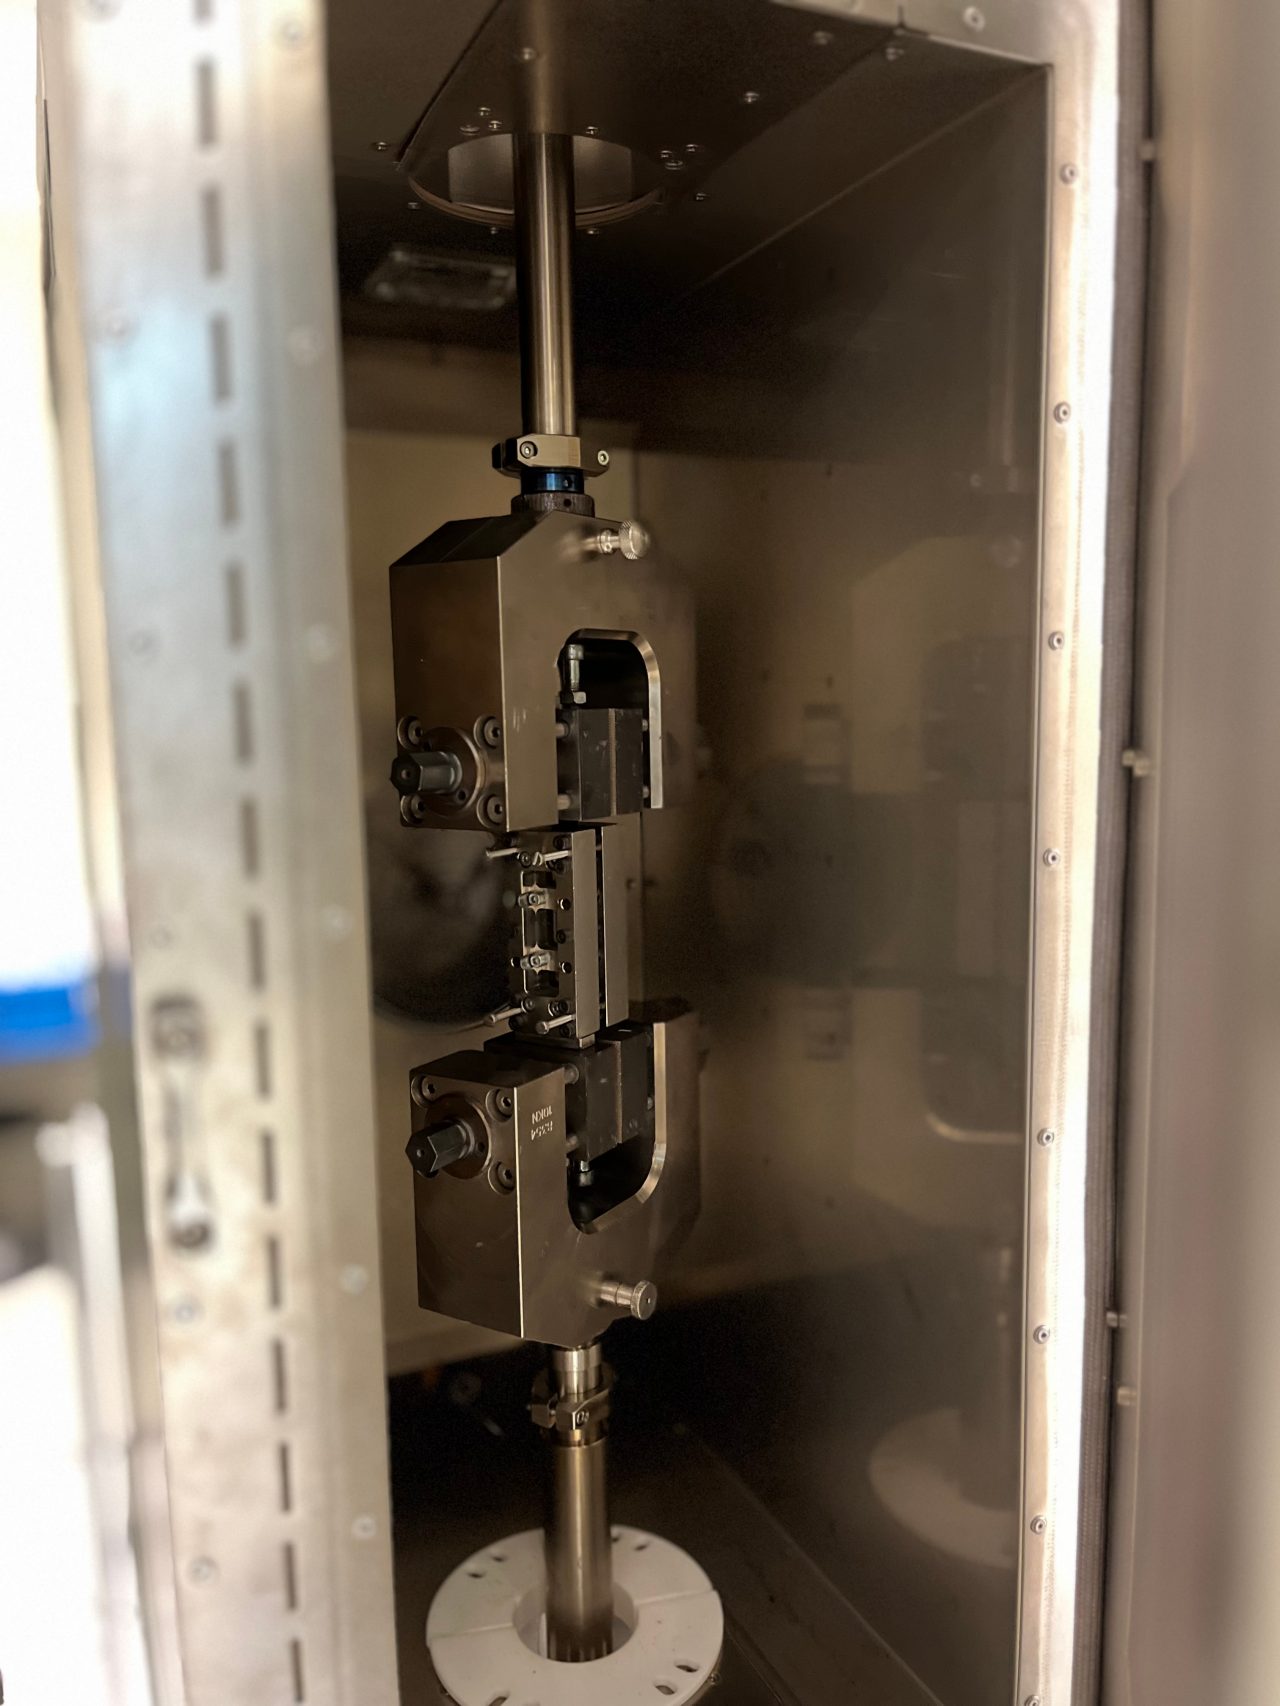
- The majority of measurements were performed according to the ISO 527 1A standard for specimen (see image) with nominal specimen width of 10.0 mm (0.4 in) and a thickness of 4.0 mm (0.16 in), produced by injection molding. In some cases ASTM D638 Type 1 specimen with a nominal width of 13.0 mm (0.5 in) and a thickness of 3.2 mm (0.13 in) were used, which give an identical fatigue response.
- For grades containing fillers like glass fibers, it is known that the fibers have a preference to orient along the longitudinal axis of the tensile bar, which has a large effect on the stress values of the fatigue response.
- Measurements were done at a specified temperature and level of relative humidity on as-molded samples. Conditioned samples were conditioned according to the ISO 1110 standard ('accelerated conditioning') under N2 atmosphere and subsequently equilibrated at 50% relative humidity before testing.
- Loading conditions: sinusoidal load with load amplitude (R-value) of 0.1 and frequencies in a range of 1-10Hz.


Model creation
- Phenomenological fatigue model with temperature (and humidity) dependent parameters. The model predicts fatigue lifetime (number of cycles-to-failure) under isothermal conditions (excluding effects of viscous heating).
- For the inclusion of conditioned samples, a Tg-depression model is applied based on the material's moisture content (see Moisture Diffusion tool). Typically, the samples are measured either dry-as-molded or after conditioning at 50% relative humidity.
Accuracy
- On average, accuracy of the lifetime predictions is within factor 3. This 'engineering accuracy' is indicated in the graph for each line by means of a semi-transparant confidence region.
- Currently, we do not provide predictions below 0°C (32°F), above 200°C (392°F) or above 50% of relative humidity.

Please use the Hotjar feedback form on the bottom right of the Fatigue tool page to submit your comments, questions, and feedback. Most frequent questions will be answered in this section.
Why can't I select all Envalior grades?
We're in the process of expanding this tool to more grades, but this depends on the availability of experimental data as well as on the demand for that particular grade. Let us know what grades you're looking for by filling in the feedback form on the bottom right of the page!
Why am I not allowed to export the data from the graph?
Everyone can use the download functionality once logged in; simply register (for free) and immediately start downloading.
