Moisture uptake affects a material's performance. This tool calculates how fast moisture diffuses through our grades as function of time and position, for both 'as molded' and 'fully annealed' samples.
Read our blogpost with more information about this tool here.
- Introduction
- Measurements
- Model
- Use-case: Absorption
- Use-case: Drying
- F.A.Q.
Polyamides are hygroscopic and moisture uptake affects polyamide properties. This tool predicts the amount of moisture uptake or release and the time scales involved. The user can select two types of calculation: a 'basic' mode calculating a single step change in conditions, or an advanced mode taking into account cyclic conditions.
‘Step change':
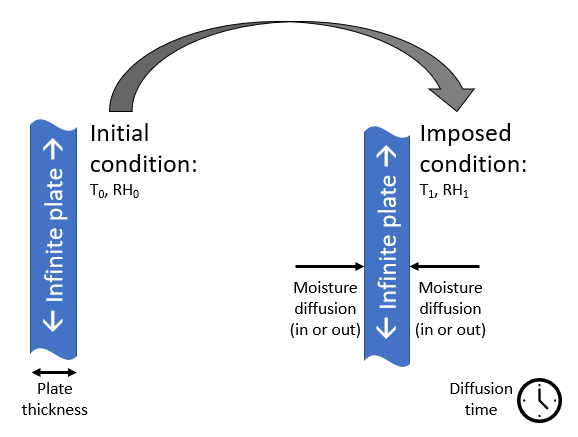
The sample is equilibrated at an initial condition (temperature T_0, relative humidity RH_0) and at time=0 is exposed to an imposed condition (temperature T_1, relative humidity RH_1) for a certain time duration. The water contents as a function of time are predicted as well as the corresponding water concentration profiles over the thickness of the sample. In this way, water uptake but also drying out-effects can be simulated.

User input:
- Grade selection
- Plate thickness (height and depth are assumed infinite)
- Initial temperature and relative humidity of the plate
- Imposed temperature and relative humidity the plate is subjected to
- The maximum time (high values require a longer calculation time)
Tool output:
- A graph displaying the moisture penetration as function of the exact position inside the plate for three points in time
- A graph displaying the position-averaged moisture concentration over time
Plates varying in thickness between 1-10 mm (0.04-0.4 in) were molded and subsequently annealed at elevated temperature (halfway between the glass transition temperature Tg and melting temperature Tm, where the crystallization speed is at its maximum). This heat treatment was done for 16 hours, which is believed to represent a substantial amount of crystallinity (although it's known that higher levels of crystallinity can be achieved with additional heat treatment). Nitrogen atmosphere was used to avoid potential oxidation of the samples.
Parametrization of the various commercial polyamide grades is based on extensive water uptake and release experimentation in the temperature regime 23 - 120°C (73-248°F). The majority of plates was put in a water bath, some were put in a conditioning chamber. Weighing the plates reveals how much moisture was absorbed over time. In dry conditions, desorption was studied in the same way.
Crystallinity
Semi-crystalline plastics typically comprise both an amorphous phase in which the polymer chains are arranged randomly as well as a crystalline (ordered) phase. Only the amorphous phase can take up moisture. However, the level of crystallinity is not a fixed material parameter, but depends on the processing conditions and ageing. After injection/blow-molding and cooling (‘dry as molded’) the plastic has not yet reached its maximum crystallinity. For some applications a state below this maximum offers advantages to the application, in other cases the fully crystalline state is desired. Dry-as-molded samples can absorp more moisture compared to annealed (or aged) materials. Over the lifetime of a part, the crystallinity usually increases (and moisture absorption decreases), but to speed up this process ‘annealing’ (heat treatment for a short period of time) can be applied.
Because the crystallinity depends amongst others on processing conditions, environmental conditions and age, it's impossible to present a single value as absolute truth for our materials. Instead, our tool provides both a prediction for the moisture content in dry-as-molded samples as well as a prediction for annealed (under the specified conditions) samples. Unless extreme annealing is applied, a part's moisture content will most likely be in between these two predictions.
On data sheets, normally the ‘dry as molded’ values are provided. For PA6, PA66 and PPA the ‘annealed’ equilibrium moisture content can be 10-20% lower, for PA46 even a factor 2 lower compared to the dry-as-molded samples.

The tool is based on an advanced physical model in which water solubility and diffusivity are accounted for. The model uses a solver to evaluate the 1-D diffusion equation in time and space.
- Chemical changes that could potentially occur due to the presence of moisture, ageing, post-crystallization or hydrolysis are not taken into account in the modeling. The magnitude of material crystallinity is addressed by presenting both a 'dry-as-molded' and a 'annealed' prediction (see also tab 'Crystallinity' for more info).
- The calculation time depends on the user input; if it takes too long, consider starting with a shorter diffusion time.
- The model is based on a plate with a thickness much smaller compared to its width and height. To account for other sample geometries such as tensile bars, a correction is applied to the model. Although the tensile bars have a standard thickness, we allow the user to deviate from this value and specify a different thickness in the input field. The standard thickness for ISO 527 1A is 4.0mm (0.157in), for ISO 527 1BA 2.0mm (0.079in), for ASTM D638 Type 1 3.2mm (0.126in) and for ISO 8256 Type 3 either 2.0mm (0.079in), 3.0mm (0.118in) or 4.0mm (0.157in).
- The accuracy of the fitted coefficients is in the order of 5% to 10% maximum (5% for the diffusion coefficients and 10% for the activation energies). For 'as molded' samples, the prediction can be slightly less accurate due to a larger variation in crystallinity, depending on the processing conditions. This 'engineering accuracy' is indicated in the graph for each line by means of a semi-transparant confidence region.


“Hello Envalior,
We’re planning to use your Stanyl® TW241F6 in our application, which has an average wall-thickness of 3.2 mm (0.13 in).
Can you advise on the conditioning time and final moisture concentration when we condition the part at either 23°C(73°F)/50%RH or use accelerated conditioning at 70°C(158°F)/62%RH? Thanks for your help.
Regards, Christine”
This question can be answered by a simple moisture uptake calculation, assuming that the part can be approached by a flat-plate geometry. Start by selecting the requested grade from the dropdown (or search the grade by typing its name) and provide the necessary input:
- Sample geometry = Infinite plate
- Plate/sample thickness = 3.2 mm (0.13 in)
- Initial temperature = 23°C (73°F)
- Initial humidity = 0% (after molding a part does not contain any moisture, this is called ‘dry-as-molded’)
- Imposed temperature = 23°C (73°F)
- Imposed humidity = 50%
- Maximum diffusion time = 100 hrs (start with a small time to speed up the calculation)
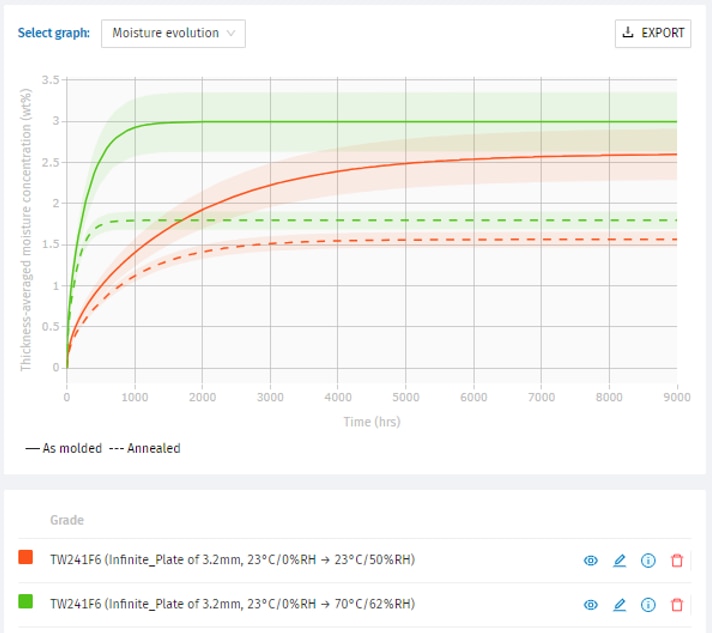
The Moisture evolution graph shows that 100 hours is not enough to reach equilibrium in this part. Click “Edit calculation” icon in the legend to increase the maximum diffusion time to 9000 hours and re-calculate by “Update calculation”.
- The graph displays two lines, the solid for ‘dry-as-molded’ samples and the dashed ‘annealed’ line for samples with a higher crystallinity. Higher crystallinity can be achieved by applying a heat/moisture treatment (see the Measurements tab for more info) but naturally also occurs as a part ages. For Stanyl® (PA46) this effect is bigger compared to other polyamides. In practice, a part’s state will probably fall between these two model predictions.
- After 9000 hours the Moisture evolution graph ‘as-molded’ is almost flat, meaning that equilibrium is reached (for annealed samples this is already the case after 4000 hours).
- In theory, the moisture concentration could be anywhere between the two lines. However, because no extreme conditions were applied the part is likely to be close to the ‘as-molded’ line with 2.6wt% moisture.

To add a graph for the accelerated conditioning at 70°C(158°F)/62%RH, the same procedure can be followed: Either select the same grade and fill in the required fields, or start from the previous calculation using the “Edit calculation” button (all input fields are now pre-filled) and click “Add new calculation”.
- Sample geometry = Infinite plate
- Plate/sample thickness = 3.2 mm (0.13 in)
- Initial temperature = 23°C (73°F)
- Initial humidity = 0% (after molding a part does not contain any moisture, this is called ‘dry-as-molded’)
- Imposed temperature = 70°C (158°F)
- Imposed humidity = 62%
- Maximum diffusion time = 9000 hrs
The Moisture evolution graph shows that the equilibrium condition is reached much faster; after 2000 hours for dry-as-molded samples. The equilibrium moisture concentration is slightly higher in this case, around 3.0wt%. Because the conditioning temperature and humidity were higher compared to the standard conditioning method of 23°C(73°F)/50%RH, the crystallinity might be slightly higher (reducing the moisture content a little bit). Although the moisture content is not necessarily identical for both conditioning methods, both will result in similar mechanical properties.

“Hello Envalior,
Injection molding of your Akulon® K122 went smooth. However, the parts with a wall thickness of 5mm (0.2 in) have been lying in our warehouse now for half a year at 20°C(68°F)/50% and taken up moisture.
How long would it take to dry them at 110°C (230°F) to a maximum moisture level of 0.1wt% in its core? Thanks in advance.
Best regards, Rick”
The required drying time can be estimated with the Moisture Diffusion tool, but has to be done in two subsequent steps; (1) calculating the amount of moisture absorbed after half a year at the specified conditions, and (2) drying back from those conditions at elevated temperature. The tool is able to handle some simple geometries, in this case the ‘infinite plate’ comes closest to the customer’s part.
The first step is absorption. After selecting ‘Akulon® K122’ from the dropdown list, the following input needs to be provided:
- Sample geometry = Infinite plate (the tool is able to handle some simple geometries, in this case the ‘infinite plate’ best resembles the customer’s part)
- Plate/sample thickness = 5 mm (0.2 in)
- Initial temperature = 20°C (68°F)
- Initial humidity = 0% (after molding a part does not contain any moisture, this is called ‘dry-as-molded’)
- Imposed temperature = 20°C (68°F)
- Imposed humidity = 50%
- Maximum diffusion time = 4380 hrs (half a year equals 182.5 days x 24 hours)
The tool provides two graphs to show the calculation results, in this example both are relevant:
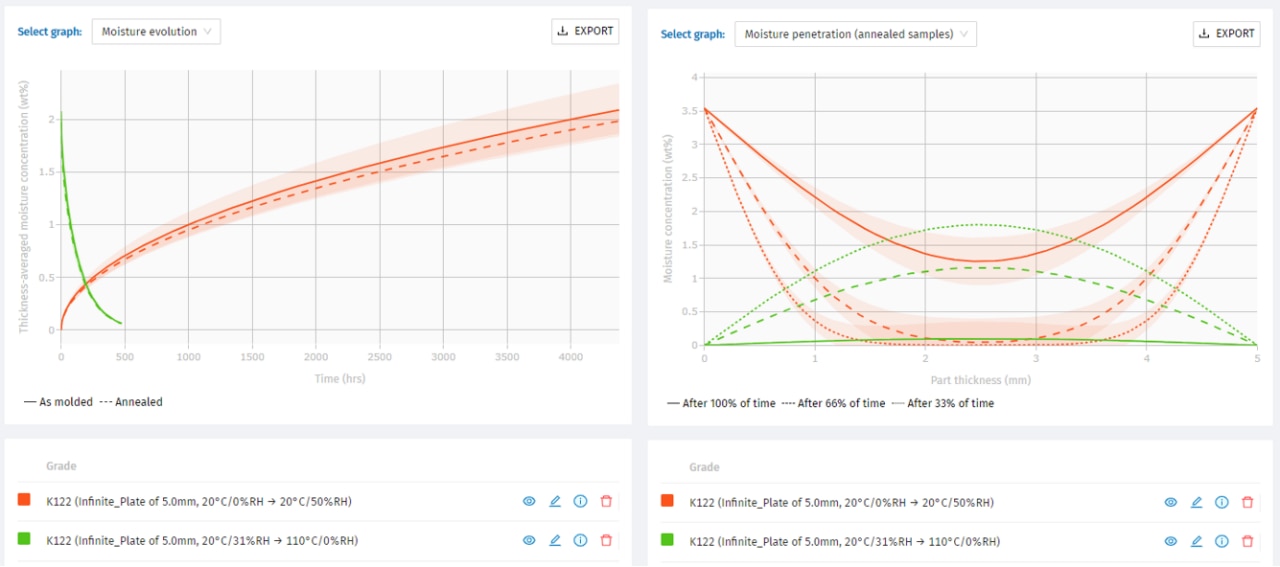
- ‘Moisture evolution’: The moisture concentration averaged of the plate thickness. This graph shows that the initial average moisture concentration is zero right after molding and rises over time. In the time frame of half a year, equilibrium is not yet reached; the average moisture concentration is 2wt%. In this case, the difference between dry-as-molded samples and annealed (heat-treated or aged) samples is very little.
- ‘Moisture penetration’: A more detailed graph showing the moisture profile over the thickness of the plate for three points in time. It can be seen that on the outside of the plate, the moisture concentration is at its maximum (3.5wt% for the selected conditions). The moisture diffuses from both sides towards the center and reaches a value of approximately 1.3wt% at its core.

The second step is drying. Generally, keeping the material at such a high temperature over a longer period of time is not recommended, because degradation can occur. It's better to dry at approximately 80°C (176°F), preferably under nitrogen.
Select the same grade from the dropdown in the input column on the left and enter all inputs. Alternatively, click the “Edit calculation” icon in the legend of the previous calculation; all fields are pre-filled and after making changes we select “Add new calculation” (Note: “Update calculation” would overwrite the previous one). A small simplification must be made, that is assuming a flat moisture profile inside the plate at the start of the drying process. Because we cannot input a ‘moisture concentration’, we need to tweak the input ‘initial humidity’ such that we obtain the same moisture concentration as at the end of the absorption step (Note: also for tweaking of an input value, it’s easiest to use the “Edit calculation” and “Update calculation” buttons). The inputs are:
- Sample geometry = Infinite plate
- Plate/sample thickness = 5 mm (0.2 in)
- Initial temperature = 20°C (68°F)
- Initial humidity = 31% (tweaked to match the 2wt% moisture concentration)
- Imposed temperature = 110°C (230°F)
- Imposed humidity = 0%
- Maximum diffusion time = 300 hrs (start with a guess, this can be adjusted afterwards)
The graph displaying the moisture profile must be inspected to find the time when the concentration at the center (in the core of the plate) has reached 0.1wt%. Of course, the outsides of the plate has a lower moisture concentration. We find that the drying time to meet the requirement is approximately 475 hours. The Moisture Evolution graph shows that when the core reaches a moisture concentration of 0.1wt%, the average moisture concentration is 0.06wt%. In reality the moisture profile at the start of the drying would not be flat, meaning that the actual drying time is slightly shorter.
Please use the Hotjar feedback form on the bottom right of the Moisture Diffusion tool page to submit your comments, questions, and feedback. Most frequent questions will be answered in this section.
Why can't I select all Envalior grades?
We're in the process of expanding this tool to more grades, but this depends on the availability of experimental data as well as on the demand for that particular grade. Let us know what grades you're looking for by filling in the feedback form on the bottom right of the page!
Why am I not allowed to export the data from the graph?
Everyone can use the download functionality once logged in; simply register (for free) and immediately start downloading.
